
What’s New in Omics Playground 5: Latest Features
Published on September 7th, 2026
⏱ 13 min read

Introduction
Omics Playground 5 introduces a redesigned interface, new AI-powered ways to interpret and communicate omics results, and expanded tools for customizing and managing your analyses.
The release is designed to make it easier for you to move from loading a dataset to exploring results, generating shareable outputs, and configuring the platform around your team’s needs.
In this post, we walk through the following main updates:
Read on to explore the exciting new features and improvements in detail!
1. New AI-powered features: Studio and Obi Chat
This release introduces new AI-powered capabilities, Studio and Obi Chat, designed to help you interpret, communicate, and explore omics results more efficiently.
Built on curated, scientifically verified analysis modules, these tools generate responses grounded in validated statistical results, helping you obtain clear, reproducible interpretations without having to write or untangle code.
Both features become available after you select and load a dataset.
1.1 Studio: your creative space

Studio helps turn analysis results into clear, editable, and shareable outputs. It can generate a summary report highlighting the main biological findings in a dataset, including insights from differential expression, gene-set analysis, WGCNA, MOFA, and a general data summary.
The workflow first runs the relevant statistical analyses and then applies the AI layer to create a narrative interpretation, allowing you to trace the conclusions back to the underlying results in your dashboard.
To validate the performance of our report-generation workflow, we benchmarked it against hundreds of findings reported in peer-reviewed studies. Across these evaluations, the algorithm recovered 51% of the claims made in the original publications.
Because Omics Playground incorporates analyses that extend beyond standard differential-expression and pathway analysis, the reports can also surface an average of 28 additional data-supported statements per study, providing a broader view of the biological insights within each dataset.

You can review and edit the generated report before sharing it with colleagues or using it as a starting point for further analysis communication.
Video 1. Editing AI summary reports in Omics Playground.
Studio can also create AI-generated infographics. Select the reports you want to use as a basis, choose a visual style, BigOmics, clinical, minimalistic, or scientific, and download the resulting infographic as a PNG file.
Here’s an overview of the different styles you can use:
- BigOmics: A signature visual style using flat vector art, a soft paper-grain texture, and a pale-yellow highlight to draw attention to key findings.
- Clinical: A precise, grid-aligned style with hairline-outlined shapes, muted earth tones, and a warm off-white background.
- Minimalistic: A clean style with rounded, softly shaded shapes, playful category colors, and simple icon-based storytelling.
- Scientific: A textbook-inspired style with pastel biology illustrations, golden highlights, and magnifier-style insets for additional detail.

Please verify AI-generated visuals. Infographics may contain inaccuracies. Always review and double-check their content before using or sharing them.
The Studio also includes tools for creating posters and slide decks. You can select which sections to include in a poster, such as Clustering, including PCA and heatmap visualizations, Phenotype Analysis, Differential Expression, and Enrichment Analysis.
This builds on the visual format previously available through the Generate reports option in Omics Playground. The Slide deck option then transforms the poster content into an editable presentation for further customization.
Unlike summary reports and infographics, posters and slide decks are not AI-generated at this time. They are created from the plots and analysis sections you select, giving you a structured, editable format for presenting your results.
1.2 Obi chat
Obi is a chat-based interface for asking questions about a loaded dataset. You can begin with suggested actions or ask your own biological questions in natural language. The assistant starts from the underlying statistics to generate interpretations and can create plots when requested.
Video 2. How to chat with your data in Omics Playground.
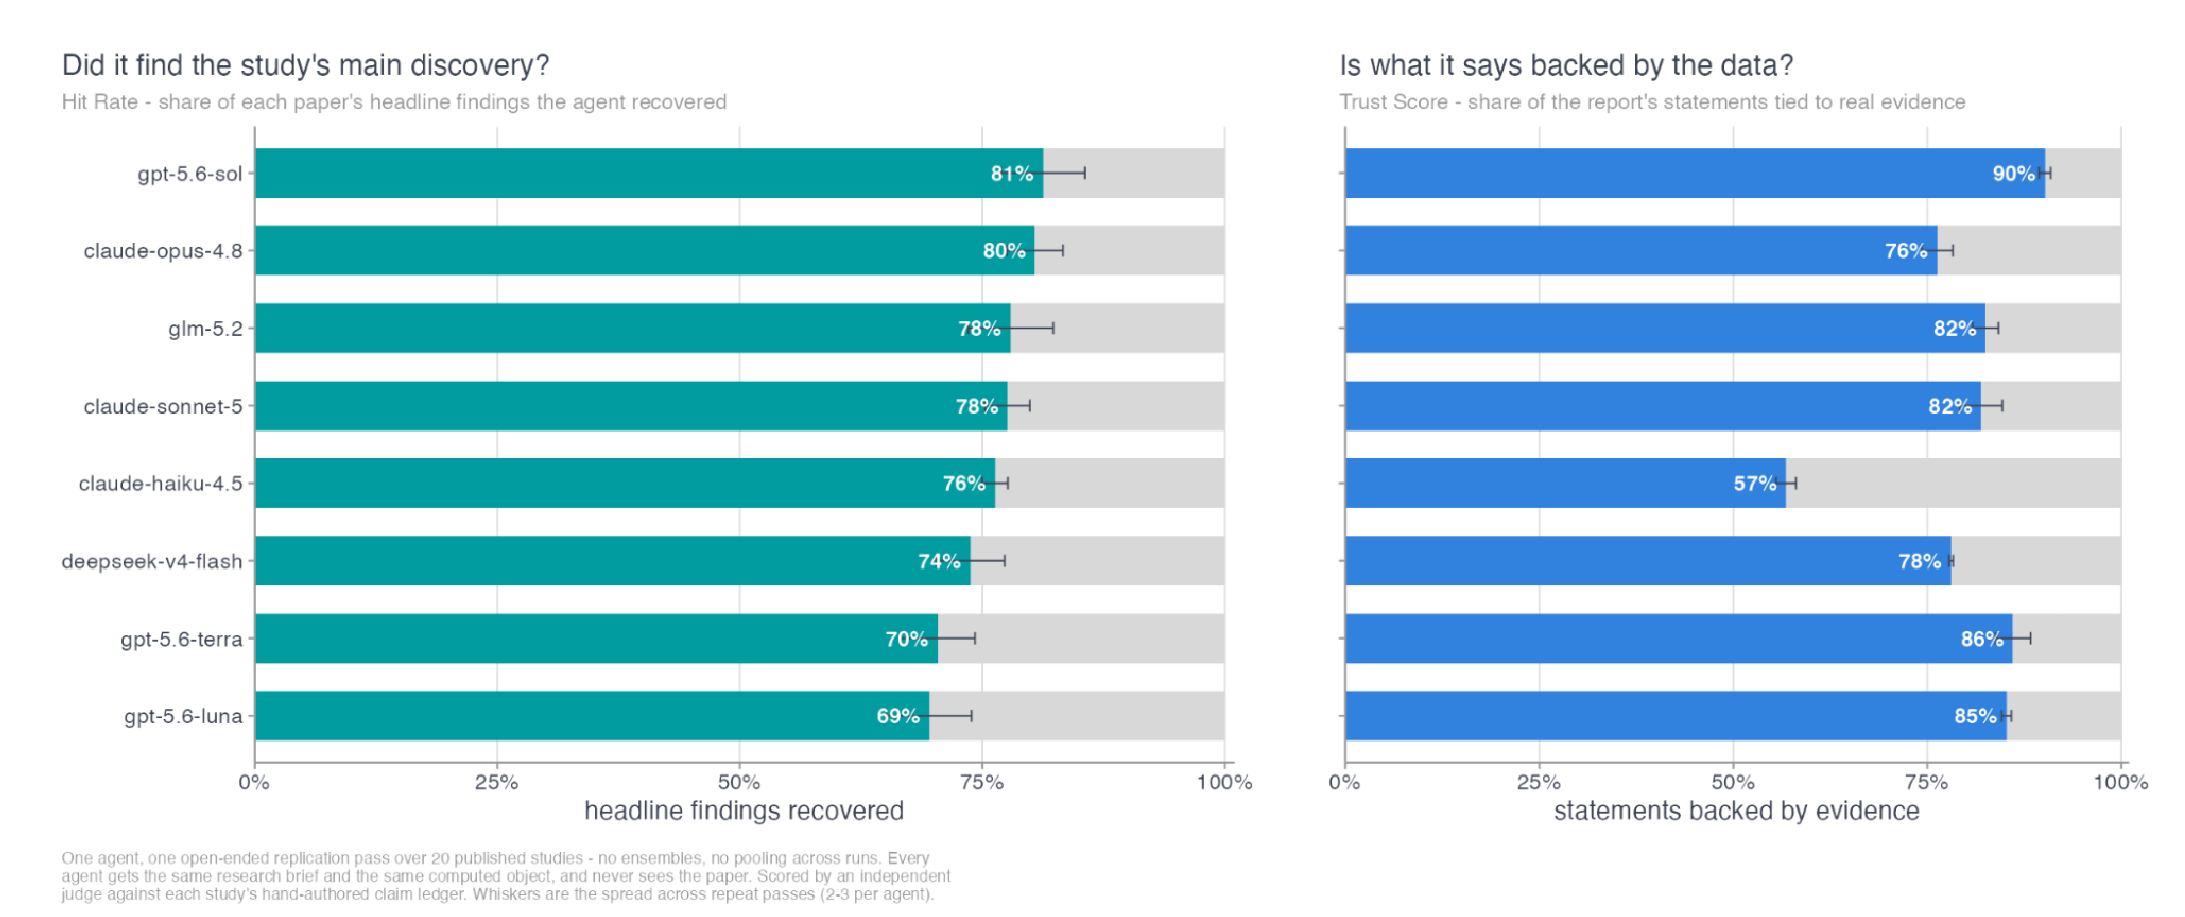
We developed Obi to function as a capable AI research assistant for biological data analysis. To evaluate its performance, we benchmarked it against hundreds of claims reported in peer-reviewed studies. For each study, we loaded the original dataset into Omics Playground and asked Obi to address the research questions investigated in the publication. Using Omics Playground’s statistical analysis tool, without additional external assistance, Obi was able to reproduce 80% of the claims assessed across the evaluated papers.
You can also upload documents to provide additional context. This makes it possible to ask follow-up questions that combine the dataset with information from supporting documents, or to ask Obi to summarize and compare findings across sources.
Like Studio, Obi is designed to provide focused answers grounded in validated statistical results, without requiring you to work through code. You can choose between a faster Balanced model for everyday questions and a more powerful Deep model for complex analytical tasks.
Obi also lets you tailor how answers are presented: select Concise for quick, direct responses, Technical for more detailed statistical and biological context, or create a custom answer style that reflects your preferred format, level of detail, or tone, so the insights are not only statistically grounded, but also presented in a way that works for you.

For greater transparency, you can also choose to display Obi’s reasoning trace and the tool calls used to generate an answer. These options are switched off by default to keep the chat interface clean and focused, but can be enabled whenever you want to inspect the analytical steps behind Obi’s response.
1.2.1. Privacy and model options
When using BigOmics AI capabilities, you can opt for a no-training, zero-retention policy: data is used to generate responses and not for model training or other purposes (Figure 6).

If your institution already has access to a preferred AI provider, you’re also able to connect an existing account so that data remains within your chosen environment. Available provider integrations may include Anthropic, OpenAI, GitHub, Google, and Mistral AI, depending on the account and deployment configuration.
These enhanced privacy options will be available only with selected subscription plans or as an additional paid feature.
As with any AI-assisted workflow, users should review generated interpretations and outputs carefully before using them to support scientific conclusions or communicating results.
If you’d like to know how your data is being processed in Omics Playground you can read the AI Features section in our Privacy Policy and Terms and Conditions.
1.2.2. Conversation history
The chat environment includes conversation history, allowing you to return to previous discussions and continue working from where you left off.
2. A redesigned, always-accessible navigation
This release introduces a refreshed application layout built around a persistent left-hand sidebar and a redesigned Home screen.
Available throughout the platform, the sidebar brings navigation and platform-wide controls into one consistent location, while the Home screen provides a clear starting point for accessing datasets, dashboards, and AI-powered tools.
The sidebar provides direct access to the platform’s main areas: Home, Library, Dashboard, Studio, and Obi AI. Settings, Help, and profile controls remain grouped at the bottom, keeping account and support tools easily accessible without taking up space in the main workspace.
The new Home screen also includes Quick actions, giving you one-click access to common tasks such as loading example data, uploading new data, opening the library, chatting with Obi, or creating content in Studio. Below these actions, dashboard cards make it easy to launch available analysis environments, including Omics Playground and MultiOmics.
By replacing the previous split navigation, with modules on the left and account controls in the top bar, with a unified sidebar and a more action-oriented Home screen, the new layout creates a cleaner workspace and a more consistent way to navigate the platform (Video 1).
Video 3. The re-designed interface in Omics Playground.
2.1 More dashboards are coming soon
We are continuing to expand the platform with three additional dashboards: Qsee/Bsee, Across, and Mythril. These will add dedicated capabilities for visual QC and batch-correction analysis, querying across datasets, and methylation exploration.
By clicking on each card, you can sign up to receive release updates and be among the first to know when each dashboard becomes available.
3. Methylation data analysis
Omics Playground now supports DNA methylation data from Illumina 450K and EPIC arrays, taking cohorts all the way from raw scanner files to covariate-adjusted differential methylation. Here’s what the new module does:
- Converts raw IDAT files into an analysis-ready beta table, with quality control built in.
- Checks sample identity and structure to catch sample swaps and batch effects.
- Estimates cell composition and epigenetic age, using ten precomputed clocks.
- Fits EWAS models live in-browser, complete with DMR calling and gene-set testing.
- Cross-references every result against the EWAS Catalog, flagging whether it’s already known or genuinely novel.

4. Additional updates you might have missed
Alongside the headline features in V5, we have also included several useful improvements that were introduced recently and may have gone unnoticed.
These additions are designed to give you greater control over how you explore, present, and manage your data.
4.1 Improved plot editor
Many plots in the platform include a built-in plot editor that allows you to customize the appearance and presentation of their visualizations. The editor is not available for every plot, and the options may differ depending on the plot type, but most editable plots provide controls for the following settings:
- Color scheme: Customize the colors used for different categories or directions, such as “Up” and “Down” in a volcano plot.
- Text sizes: Adjust the size of labels, data-point labels, and axis text.
- Margins: Modify the plot margins when additional space is needed around the visualization.
- Aspect ratio: Set a custom aspect ratio to control the relative width and height of the plot.
- Axis limits: Define custom limits for the plot axes.
- Labels: Customize which features are labelled and how labels are displayed. Depending on the plot, you may be able to label selected features, add custom labels, adjust the padding around labels, and choose whether labels are displayed with connecting lines or boxes.
- Plot themes: Apply an alternative visual theme, such as the ggprism theme, where available.
- Significance cutoff: For plots that display statistical significance, choose between the available cutoff types, such as the traditional rectangular cutoff or a hyperbolic cutoff.
Each setting is organized in an expandable section, making it easy to locate and adjust the relevant options. If you want to return to the original visualization, you can always reset the plot to its default settings.
Video 4. Plot editor overview in Omics Playground.
4.1 Admin panel (Enterprise feature)
The new Admin panel, available with Enterprise subscriptions, gives designated team administrators greater control over how their organization uses Omics Playground.
It allows admins to manage users, datasets, and the level of functionality visible across the deployment, helping teams create a more focused workspace that reflects their workflow and users’ needs.
The Admin panel includes four dedicated views:
- Overview: View key account information at a glance, including the number of users and the number of datasets stored in user, shared, and public locations.
- User management: See all user email addresses associated with the account and assign administrator rights to another user when needed.
- Basic menu: Configure a simplified version of the platform for your team. Admins can choose which module and Settings menu items remain available when users enable the Basic menu in their Settings. They can also select which dashboards should have advanced settings disabled in Basic menu mode; dashboards that are not selected retain their full settings, while dashboards without advanced options are unaffected. Changes can be previewed immediately in the admin’s own session when the Basic menu is enabled, then saved and applied across the full deployment. Other users will see the updated configuration after reloading the page.
- Data management: Browse datasets across individual user folders, shared directories, and public directories, then move or delete datasets as required.

By centralizing these controls, the Admin panel makes it easier to maintain a clear, consistent environment for all users while retaining the flexibility required to support different teams and analysis workflows.
Try the new release
This release makes Omics Playground easier to navigate, more flexible to customize, and more powerful for turning omics data into interpretable results and shareable outputs. Load a dataset and explore the new Studio and Obi Chat, customize your plots, and discover the tools available in the redesigned interface.
If you’d like to know more about the new features or want to share your experience with the new release, feel free to reach out to our team here. We’re always eager to hear your feedback, as it helps us improve your experience.
If you are using the AI features as a free user, remember that access is available for a limited time; upgrading your account will allow you to continue using them after the introductory period.
Don’t wait, explore the latest Omics Playground features today and see how they can enhance your study.
New to Omics Playground? Register below for a free trial!