Imputation of Missing Values in Proteomics

What causes missing values in proteomics and how to assess several imputation methods.

Published on January 16th, 2024
Written by Ivo Kwee, CTO

Bioinformatician at computer looking at a comparison between imputation methods in proteomics

Introduction

Missing values (MVs) reduce the completeness of biological data. In this blog post, we examine this issue and its root causes in proteomics data, and assess several imputation methods.

How Do Missing Values in Proteomics Arise: Missing at Random or Missing Not at Random

Missing values in proteomics may be due to:

  1. True absence of the molecule;
  2. The molecule levels are below the instrument’s sensitivity;
  3. A molecule could be undetected due to experimental factors, measurement noise, analytical errors, or when a molecule is misclassified.

MVs due to 1 or 2 are called ‘censored’ and depend on the abundance of the molecule. Molecule levels below the detection limit cause ‘left censoring’. In principle, ‘right censoring’ could also occur if intensities are above the instrument’s saturation limits, though this phenomenon is not common.

More generally, values can miss at random (MAR), or miss not at random (MNAR). Typically, MAR proteomic values are caused by chance or technical/experimental factors and are thus independent from the molecule dosage. Differently, MNAR proteomics values can arise from low intensity signals. Altogether, MAR & MNAR represent the majority of MVs in proteomics.

But, are MVs mostly MAR or MNAR? 

We can assess this by plotting the ratio of MVs against the average intensity (log2) of the proteins in a typical dataset. We see that the missingness is more prominent at lower intensities (20-24, log2 scale) suggesting prevalence of MNAR [Figure 1A]. 

Interestingly, MVs form patterns when clustered, as shown in the heatmap [Figure 1B]. Therefore, in line with current knowledge, MNAR represent the largest source of missingness in proteomics data

Figure 2. (A): Ratio of MVs versus average signal intensity in a typical proteomics dataset. (B): MVs patterns of a typical proteomics dataset shown by hierarchical clustering of missing vs non-missing values. These plots are available in Omics Playground.
Figure 1. (A): Ratio of MVs versus average signal intensity in a typical proteomics dataset. (B): MVs patterns of a typical proteomics dataset shown by hierarchical clustering of missing vs non-missing values. These plots are available in Omics Playground.

Mind the Gap Between Zero and Minimum Detected Intensity

The missing values problem seems to be more prominent for proteomics and metabolomics than RNAseq data. While in RNAseq undetected genes have zero counts, undetected proteomics and metabolomics features are reported as MVs (eg. ‘NA’). Let’s take a look to how differently the data distribute in a typical RNAseq and proteomics dataset [Figure 2]. 

RNAseq CPM values show a typical Poisson or NB distribution and mostly fall within the 0-15 (log2 scale) range, with inflated zeros [Figure 2A]. Differently, proteomic intensities populate a much higher range, e.g., >20 (log2 scale) [Figure 2B].

Signal histogram of (A) typical RNA-seq dataset and (B) proteomics dataset. For RNA-seq counts data the detected signal starts immediately after zero. In contrast, proteomics signals start around 16-20 and mostly populate the range 20-35. The “gap” between zero and 20 has almost no signal.
Figure 2. Signal histogram of (A) typical RNA-seq dataset and (B) proteomics dataset. For RNA-seq counts data the detected signal starts immediately after zero. In contrast, proteomics signals start around 16-20 and mostly populate the range 20-35. The “gap” between zero and 20 has almost no signal.

Mind the gap: there’s a huge gap between zero and the start of the signal in the proteomics data. What happened to intensity values below the minimum detected intensity? 

Reasonably, ‘no-detection’ can’t be well represented by a zero: this would create a single peak at 0 hugely distanced from the minimum detected intensity, leading to skewed fold-change or SD for low intensities. Rather than being assigned zero, undetected intensities in proteomics are rather assigned as MVs, as the minimum detected intensities are often much higher than zero. 

How could this problem be addressed? Simply, we could minimize the gap in the distribution by performing a global scaling of the intensities or shifting the log2 data value distribution to the left side. Alternatively, as we do below, we could impute MVs.

Imputation Methods of Missing Values in Proteomics Datasets

MVs in data matrices make problematic principal component analysis, batch correction and clustering. Therefore, MVs reduce discovery power and should be accurately ‘imputed’. 

Previous works have compared different imputation methods. 

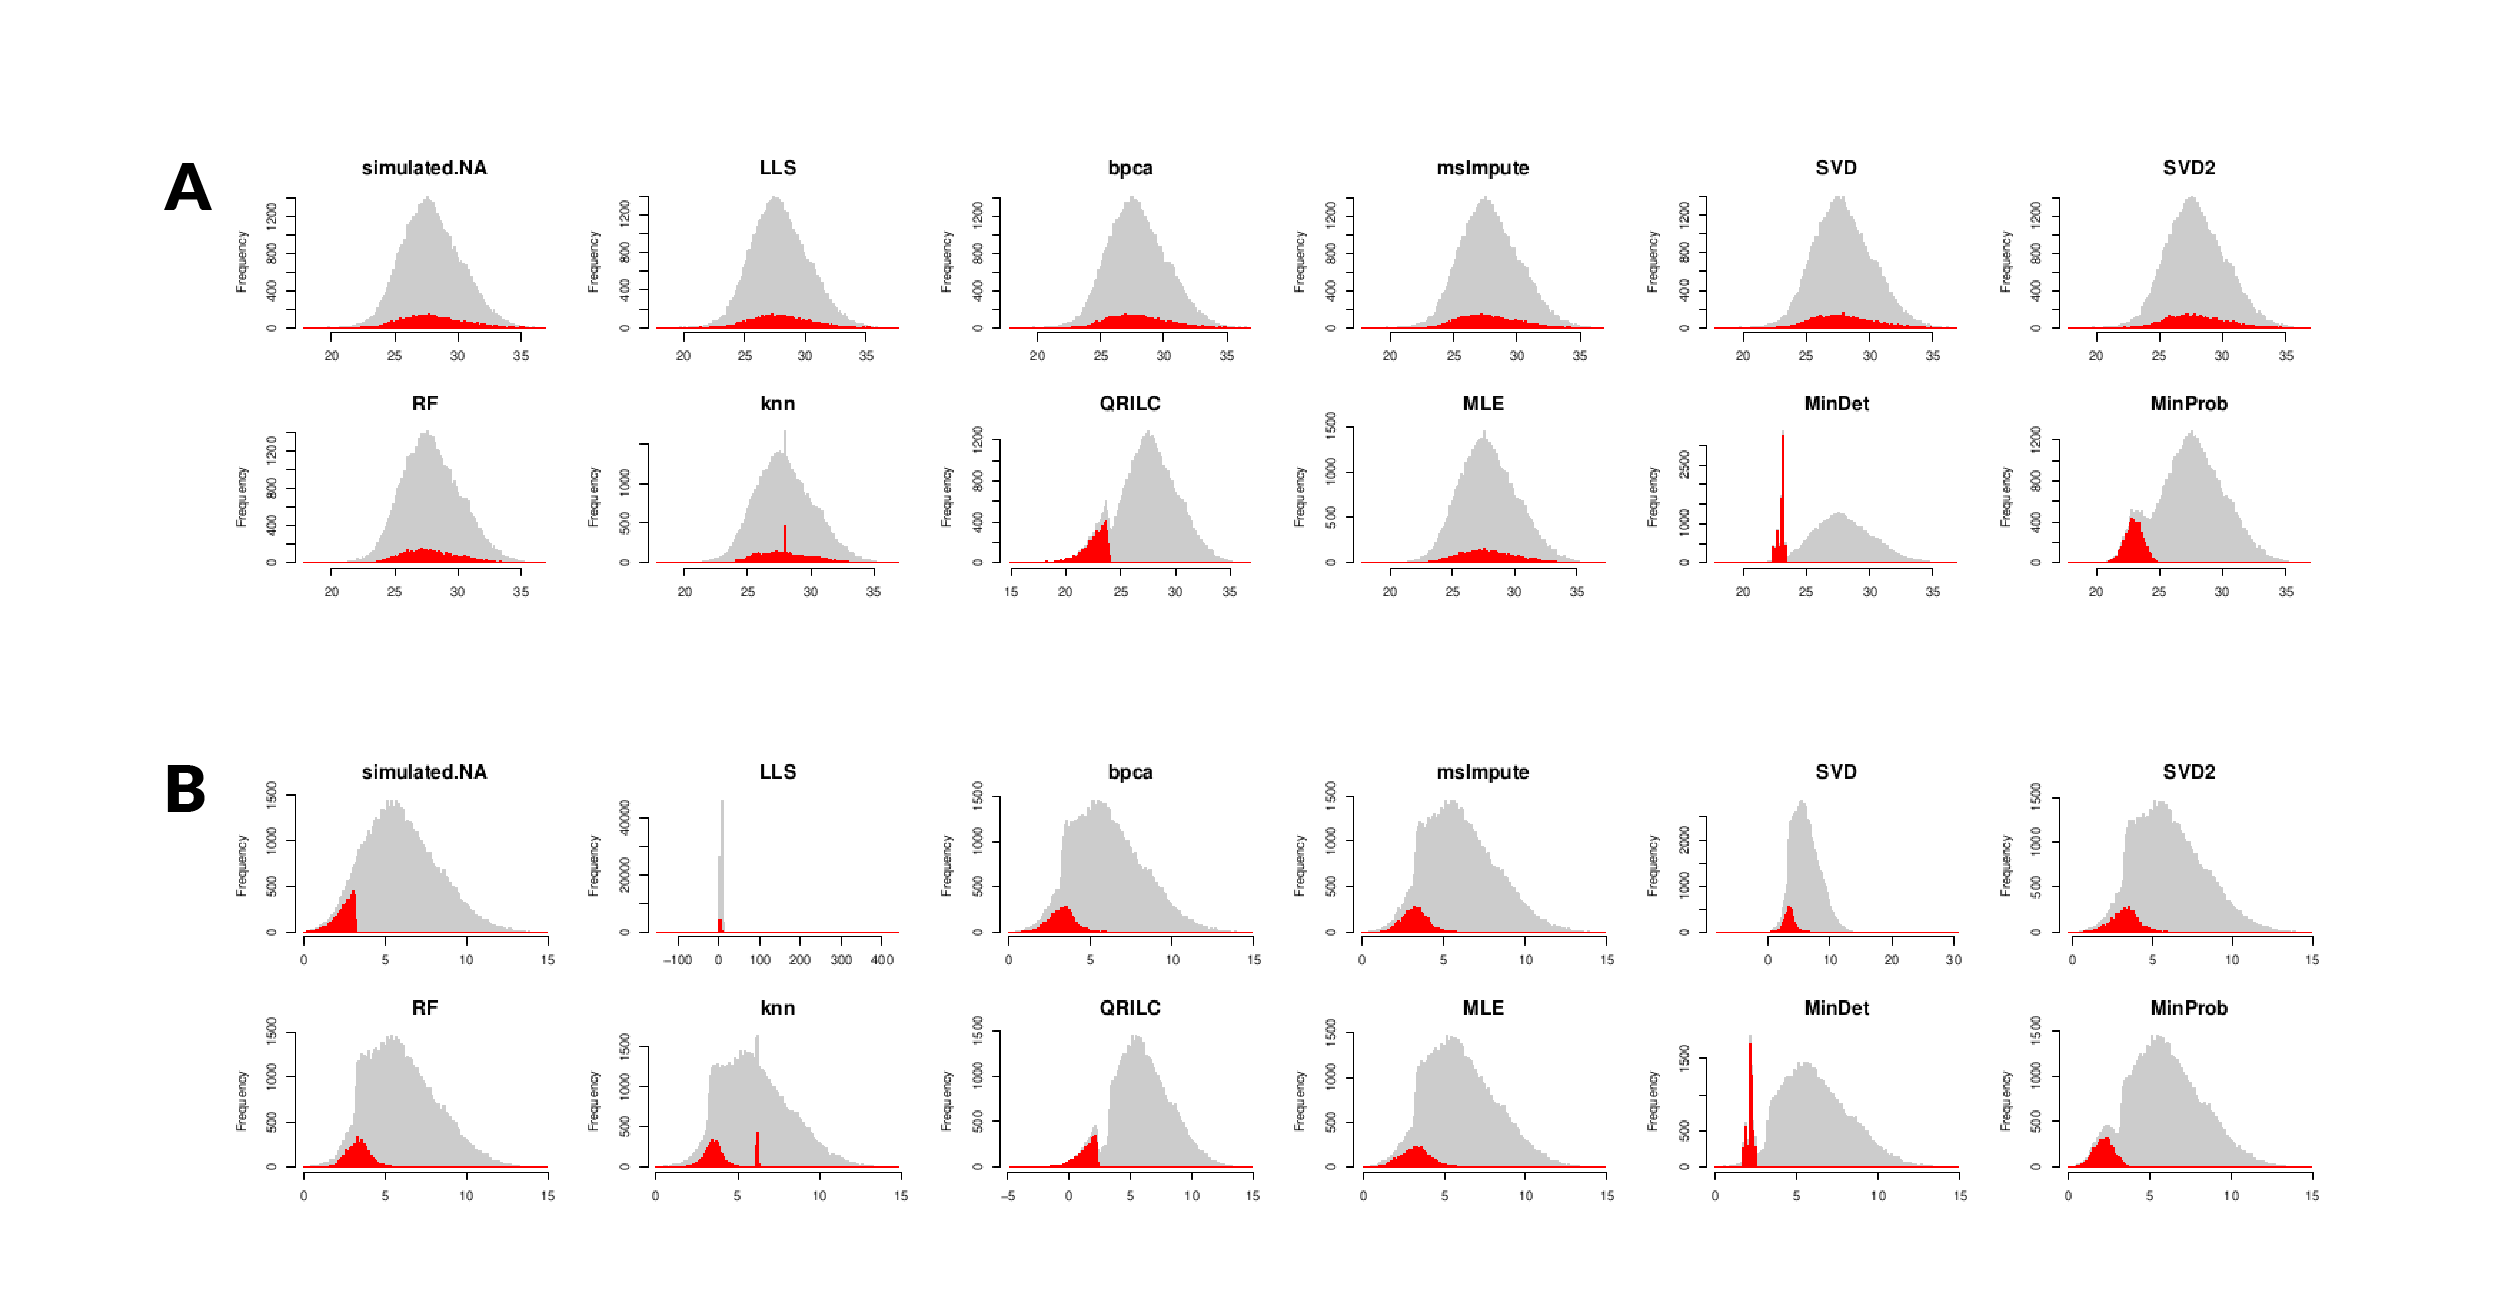
For example, Jin et al. (1), compared LOD, ND, kNN, LLS, RF, SVD and BPCA. They concluded that RF and LLS are the best performing imputing methods, and that BPCA outperforms SVD. The MNAR ratio affected the accuracy of all datasets. 

Wei et al. (2), compared performance and accuracy of 8 distinct methods in metabolomics data, including half-minimum, zero, mean, median, RF, SVD, kNN and QRILC. They also recommended RF as the best imputing method for MAR, while QRILC to be preferred for left-censored MNAR MVs. 

Wang et al. (3), integrated 23 imputation methods into the R package NAguideR and evaluated their performance in proteomic data. Differently to previous studies, they found that BPCA and KNN-based rank among the top methods. In summary, RF, LLS, BPCA, and KNN are often reported as top-ranking methods. However, they are also often among the slowest.

Ideally, the imputation method of missing values in proteomics should be tailored to the nature of MVs. For instance, left-censored MNAR could be imputed with left-censored-specific methods like LOD and ND, while MAR imputed with RF and LLS. However, this is of difficult application for real world datasets where is difficult to disentangle MAR and MNAR.

Testing the Distinct Imputation Methods

Here at BigOmics Analytics, we have compared different imputation methods. We employed some R meta-packages that conveniently integrate single-value, global-structure and local-similarity-based imputation methods:

  • MSnbase (BPCA, KNN, QRILC, MLE, MLE2, MinDet, MinProb, min, zero, mixed, nbavg, with, RF, none);
  • pcaMethods (BPCA, svdImpute, PPCA, Nipals PCA)
  • NAguideR (zero, minimum, column median, row median, BPCA, SVD, KNN, Seq-KNN, trKNN, Mice-norm, Mice-cart, MLE, QR, MinDet, MinProb, LLS, Impseq, Impseqrob, IRM, RF, PI, GRR, GMS).

For testing, we created artificial datasets with MVs. Specifically, we used a subset of a complete real dataset without MVs and artificially introduce MAR or MNAR MVs. For the different algorithms, we then compared their imputed values against the real proteomics values [Figure 3].

Figure 3. Scatter plots for different imputation methods of imputed values (y-axis) versus real values (x-axis). The red points are missing/imputed values. Top two rows (A): MAR induced missing values. Bottom two rows (B): MNAR induced missing values at the lower 20% intensity range. The SVD2 method is our re-implementation of SVD.
Figure 3. Scatter plots for different imputation methods of imputed values (y-axis) versus real values (x-axis). The red points are missing/imputed values. Top two rows (A): MAR induced missing values. Bottom two rows (B): MNAR induced missing values at the lower 20% intensity range. The SVD2 method is our re-implementation of SVD (see below).

Which Imputation Method Is the Most Accurate and Which Is the Fastest?

In agreement with previous studies, we also found that RF and BPCA were often the best in terms of accuracy and smallest error [Figure 3]. However, they are also the slowest among the methods, requiring several minutes to hours for larger datasets. 

LLS also performed well, but it was not very robust as it sometimes exited with errors when dealing with small matrices; notice how LLS misbehaves considerably in the MNAR simulation (Figure 4B). Non-negative matrix factorization (NMF), a method that factorizes a matrix into non-negative parts, also performed well. As expected, the simplest imputation methods (min, MinProb, MinDet) were also the fastest, but showed the lowest accuracy.

We observed that both matrix factorization (SVD or NMF) or regression based methods (RF, LLS, MLE), can effectively model both MAR and MNAR MVs [Figure 3, Figure 4], challenging previous reports of model-based methods as only applicable to MAR. By modeling the missingness, these methods work well in both MAR and MNAR cases.

Finally, we ranked the methods by their error rate and runtime [Figure 5]. A lower rank indicates smaller error or shorter runtime. 

Figure 4. Scatter plots for different imputation methods of imputed values (y-axis) versus real values (x-axis). The red points are simulated missing/imputed values. The data is a real proteomics dataset without MVs but with MAR introduced artificial MVs. The SVD2 method is our re-implementation of SVD.
Figure 4. Scatter plots for different imputation methods of imputed values (y-axis) versus real values (x-axis). The red points are simulated missing/imputed values. The data is a real proteomics dataset without MVs but with MAR introduced artificial MVs. The SVD2 method is our re-implementation of SVD (see below).
Figure 5. Error and runtime ranking of several imputation methods. Lower rank means smaller error or shorter runtime. The algorithms were subjected to a variety of datasets with both MAR and MNAR artificially created MVs. The SVD2 method is our re-implementation of SVD (see below). The algorithms with postfix ‘T’ denote the algorithm but run on the transposed matrix. Interestingly, some methods differ substantially in accuracy and runtime if run on the transposed matrix, an observation that requires further analyses.

Our Work Towards the Best Imputation Method for Missing Values in Proteomics

SvdImpute: Best balance between accuracy and speed

SVD is an elegant linear algebra algorithm. It decomposes a matrix into two orthogonal bases in row and column space.  Notably, the SVD-based imputation methods seem to provide the best balance of accuracy, robustness and computation time compared to the other tested methods. SVD-based imputation handles both MAR and MNAR accurately, is robust, and scales nicely even to large sample sizes. Therefore, we focused on further improving SVD-based imputation. 

Improving svdImpute in pcaMethods

The svdImpute() algorithm in the R package pcaMethods uses SVD to impute MVs using a low-rank estimation of the complete matrix in an iteratively manner.  In the aim to improve and make it faster, we modified the svdImpute algorithm. In particular, we noticed that in the code MVs are set to zero at the first iteration. While PCA is often performed on the covariance matrix that has zero mean, imputation on general matrices should not be expected to have zero mean. This might contribute to the reportedly lower performance of svdImpute() compared to other methods. We also modified the algorithm to use irlba() for the SVD decomposition and improved the overall computation speed with 40% compared to using svd() or prcomp()

The performance of our re-implementation is shown as ‘SVD2’ in Figures 3 and 4. Our implementation shows to be more robust (smaller spread), with reduced error and runtime than the original implementation (‘SVD’). Our improved implementation of the svdImpute algorithm is available in our bigomics/playbase source code as svdImpute2().

Impute before or after normalization?

Whether it is better to apply imputation to the raw or to the normalized data is still unclear.  Preprocessing steps of filtering, normalization and transformation may affect the accuracy of imputation. In some cases, imputation of normalized data might be beneficial (Karpievitch et al., BMC Bioinformatics 2012). We believe this may be context-dependent, warranting separate, systematic benchmarking analyses.

Conclusions

The missing value problem in proteomics (and metabolomics) data remains a key issue. Selecting the appropriate imputation method is important to accurately augment the data and enable downstream analyses. 

In proteomics, MVs are mainly a MNAR problem correlated with low intensities and exacerbated by the “zero gap” within the data values. Without global scaling, these MVs should be properly imputed. 

According to multiple studies, BPCA and RF are among the top performing methods. However, for the large datasets nowadays employed in research, they are slow and may be unserviceable. 

We found svdImpute to deliver the best balance between accuracy and speed. We modified its implementation to further improve speed, thus making it better for our purposes when dealing with large matrices. Our re-implementation is available in Omics Playground

About the Author

Ivo Kwee

Ivo Kwee holds a BSc degree in Engineering Physics, an MEng in Applied Physics and a PhD in Medical Physics. He has over 16 years of experience in bioinformatics and is currently CTO and co-founder of BigOmics Analytics, where he contributes to the mission of creating the best self-service analytics platform that enables life scientists to analyze their omics data. 

References

  1. Jin et al. “A comparative study of evaluating missing value imputation methods in label-free proteomics”. Scientific Reports, 2021.
  2. Wei et al. “Missing Value Imputation Approach for Mass Spectrometry-based Metabolomics Data”. Scientific Reports 2018.
  3. Wang et al. “NAguideR: performing and prioritizing missing value imputations for consistent bottom-up proteomic analyses”. NAR 2020.
  4.   Karpievitch et al. “Normalization and missing value imputation for label-free LC-MS  analysis”. BMC Bioinformatics, 2012.