
Whole Blood Transcriptome Changes Following Controlled Human Malaria Infection

Published on April 25th, 2020
Written by Axel Martinelli
⏱ 5 min read

Blood dna

Introduction

For Malaria day, we decided to re-analyse the data (GSE97158) from a published article. The data is currently available on the public ARCHS4-omics Playground (now Omics Playground).

In their study, the authors performed controlled infection with Plasmodium falciparum in volunteers who had been previously exposed to malaria and followed gene expression from liver to blood stages at three different time points post-inoculation (day 5, 9 and 28).

Clustering analysis and Differential expression

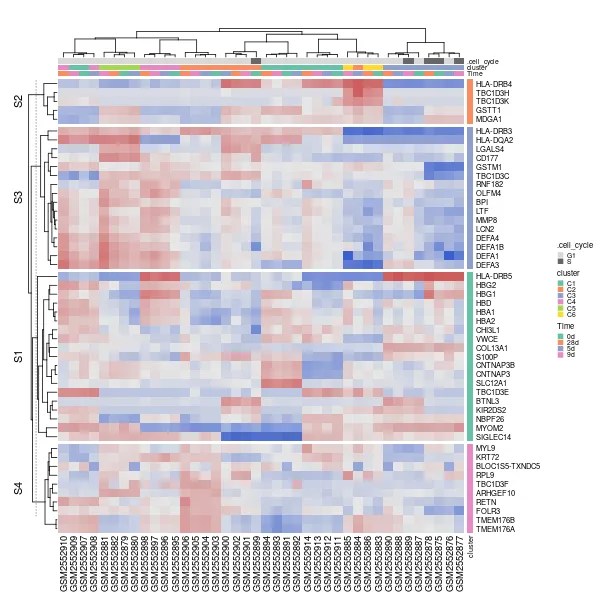
There was no observable clustering by time point in the dataset, because of large differences between individuals, as noted in the original paper (Figure 1).

Clustered heatmap of the 40 samples in the study.
Figure 1. Clustered heatmap of the 40 samples in the study.

We applied a more stringent analysis than the authors of the papers, by intersecting three different methods to perform differential gene expression analysis (EdgeR, Deseq2 and limma), with a maximum FDR for significance of 0.05 and a minimum logFC of 0.5. Still, differential gene expression analysis reflected the original finding of the authors. The comparison yielding the most genes was day 5 vs day 9, while there was no difference between day 0 and day 9 (Figure 2).

Volcano plots of differential gene expression values across all the available pairwise comparisons.
Figure 2. Volcano plots of differential gene expression values across all the available pairwise comparisons.

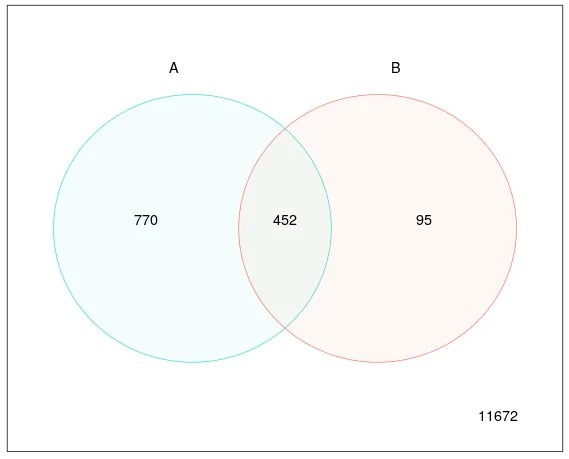
We also observed a large number of differentially expressed genes shared between comparisons “day0_vs_day5” and “day5_vs_day9” (Figure 3), as also highlighted in the published article.

Venn Diagram showing the intersection between comparisons “day5_vs_day9” (A) and “day0_vs_day5” (B).
Figure 3. Venn Diagram showing the intersection between comparisons “day5_vs_day9” (A) and “day0_vs_day5” (B).

GO terms analysis

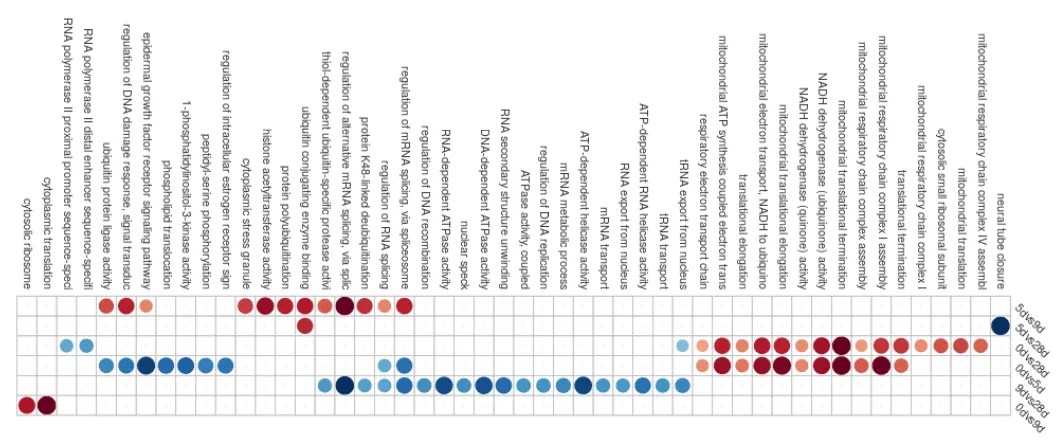
GO terms analysis revealed gene sets that were differentially expressed in the various time points, reflecting the original observations of the authors (Figure 4). Thus, for example, ubiquitination-related and transcription-related terms were downregulated in the “day0_vs_day5” comparison, but upregulated in the “day5_vs_day9” comparison. Inositol phosphate pathways were also downregulated in the “day0_vs_day5” comparison.

The GO activation matrix visualises the activation of GO terms across conditions.
Figure 4. The GO activation matrix visualises the activation of GO terms across conditions.

Geneset Enrichment Analysis

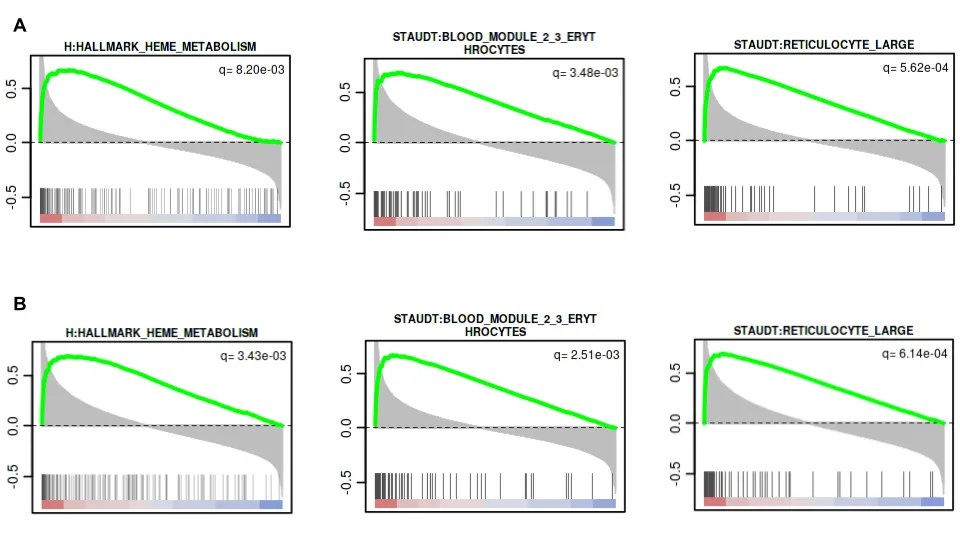
The “Geneset Enrichment” (GSE) module of the platform was used to perform a GSE analysis using the intersection of three different methods (camera, fgsea and gvsa) and an FDR cut-off of 0.05. The upregulation of erythrocyte development and heme biosynthesis gene sets was also observed at later time points (“day0_vs_day28”, “day5_vs_day28”) , consistent with the appearance of parasite blood stages later in the infection, as described in the article (Figure 5).

GSEA plots for heme-metabolism and erythrocyte development gene sets in comparisons “day0_vs_day28” (A) and “day5_vs_day28” (B).
Figure 5. GSEA plots for heme-metabolism and erythrocyte development gene sets in comparisons “day0_vs_day28” (A) and “day5_vs_day28” (B).

Drug Connectivity Analysis

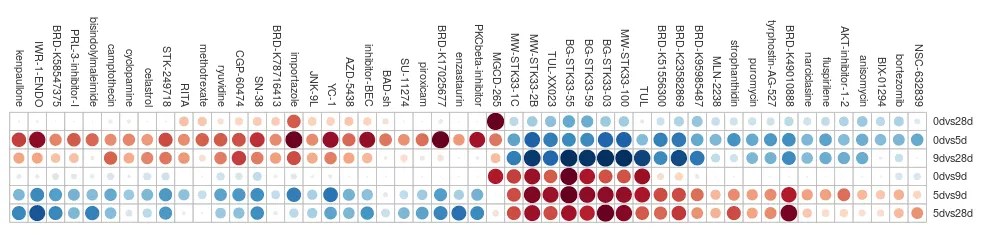
As an additional piece of analysis, we compared the gene expression profiles of the various comparisons against the Drug Connectivity Map database through the “Drug Connectivity” module in the platform (Figure 6). 

We focused only on the Day0 vs Day 5 and Day 28 comparisons (since the Day 0 vs Day 9 comparison yielded no significant differentially expressed genes) to find suitable candidates. 

The activation matrix indicated several drugs with known antimalarial activity among the drugs with most potential inhibitory profiles. These included puromycin and anisomycin, two translation inhibitors with tested antimalarial activity. The antipsychotic drug fluspirilene has also been proposed as a drug for repurposing to treat malaria. 

It is also interesting to notice the presence of compound NSC-632839, a ubiquitin specific protease inhibitor, in the list, due to the important role played by the ubiquitin-proteasome system in malaria infections. 

It is also worth noticing the inhibitory potential of bortezomib, a proteasome inhibitor used in cancer therapy, against the early liver-stages of malaria (day 5). Bortezomib is indeed well known as a drug with a potent antimalarial activity specifically against the liver-stages of the parasite.

The activation matrix visualises the activation of drug activation enrichment across the available pairwise comparisons.
Figure 6. The activation matrix visualises the activation of drug activation enrichment across the available pairwise comparisons.

As a final note, the presence of methotrexate as a positively correlated drug is intriguing. Methotrexate is an antifolate, akin to the well known antimalarial drug pyrimethamine, and has been shown to have potent antimalarial activity against Plasmodium species (here and here). 

Whether this is a coincidence or whether, at least in the case of malaria infection, a positive correlation may indicate antimalarial potential, may be an issue worth exploring further.

Scientist with lens exploring the drug connectivity analysis tab in Omics Playground

Unlock the full potential of your RNA-seq and proteomics data.

About the Author

Axel Martinelli

Axel Martinelli’s academic background is in molecular biology and parasitology. He earned a Ph.D. on the genetics of strain-specific immunity against malaria infections and a master’s degree in bioinformatics with specialization in the analysis of omics data. During his postdoctoral career, he worked on genomics and transcriptomics studies and is currently the head of biology at Bigomics Analytics.